Introduction
These patterns, in the right clinical context, are suggestive of acute coronary occlusion and require immediate reperfusion therapy without any delay! It’s our responsibility to identify these EKG patterns early and save the patients’ lives, the cardiologist isn’t always available to interpret EKGs for you! Knowing and memorizing these patterns is key to recognizing these patterns!
Important facts about acute coronary syndrome
- Acute coronary syndrome is a dynamic process in which the coronary artery may spontaneously open and close. This causes alternating periods of symptoms and symptom-free intervals, with corresponding changes in the EKG. This is why obtaining serial EKGs is important for accurate diagnosis and monitoring.
- Symptoms and EKG changes provide a real-time snapshot of ongoing myocardial ischemia, while troponin levels may initially be negative, as they typically rise 2-3 hours after symptom onset.
- EKG changes in acute coronary syndrome can range from subtle to obvious. As you see in the image below, when an acute coronary occlusion occurs, a hyper-acute T wave develops within minutes to hours, followed by ST elevation, followed by the development of a pathological Q wave if prompt reperfusion therapy isn’t provided! If reperfusion is achieved, T-wave inversion develops.
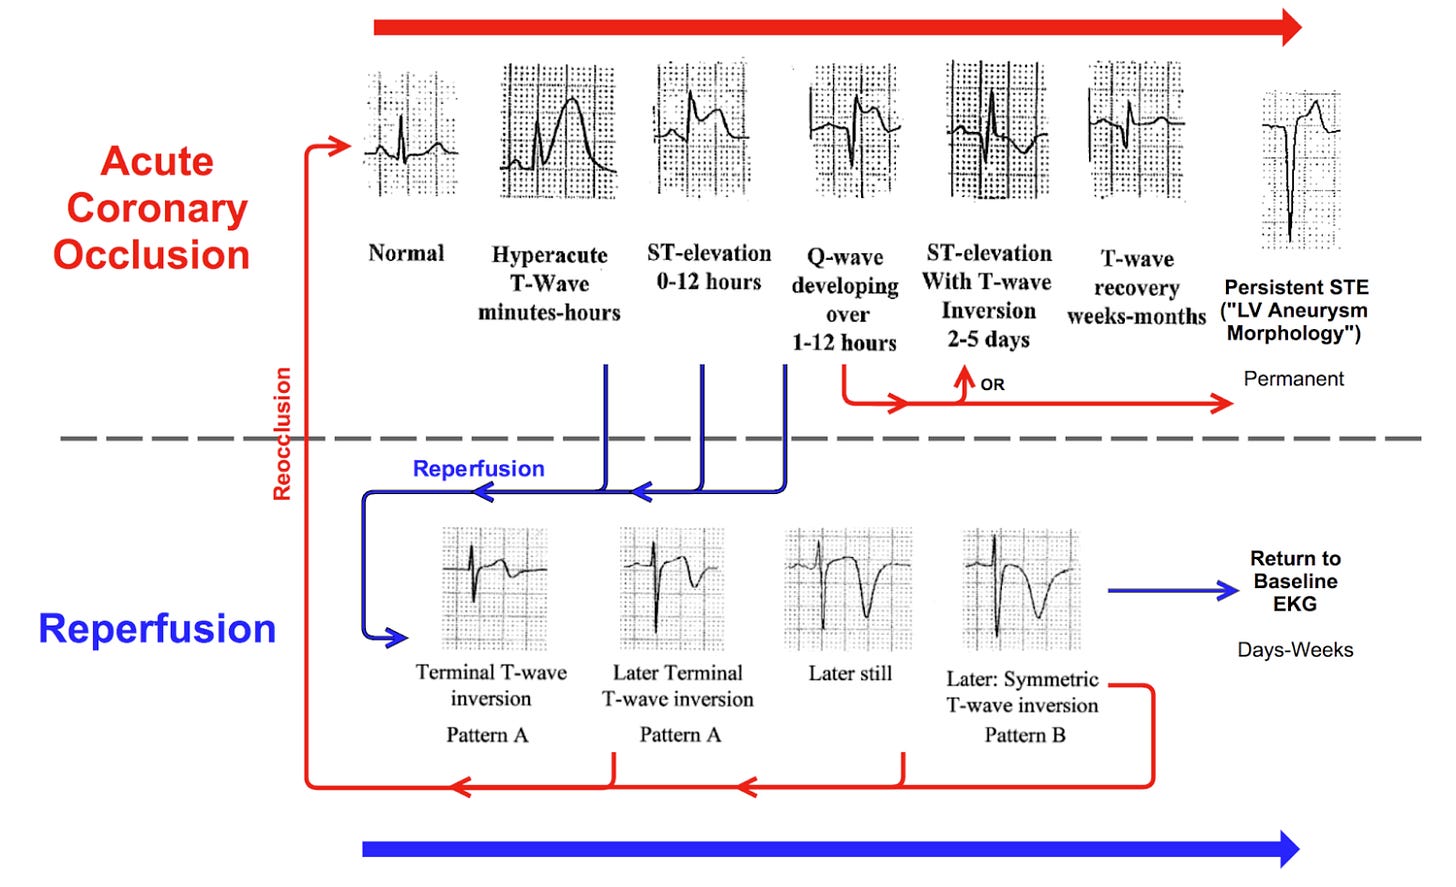
( Not all patients must develop this sequence of EKG changes! Many with acute coronary occlusion may develop hyperacute T wave without ST elevation at all!)
The traditional STEMI pattern
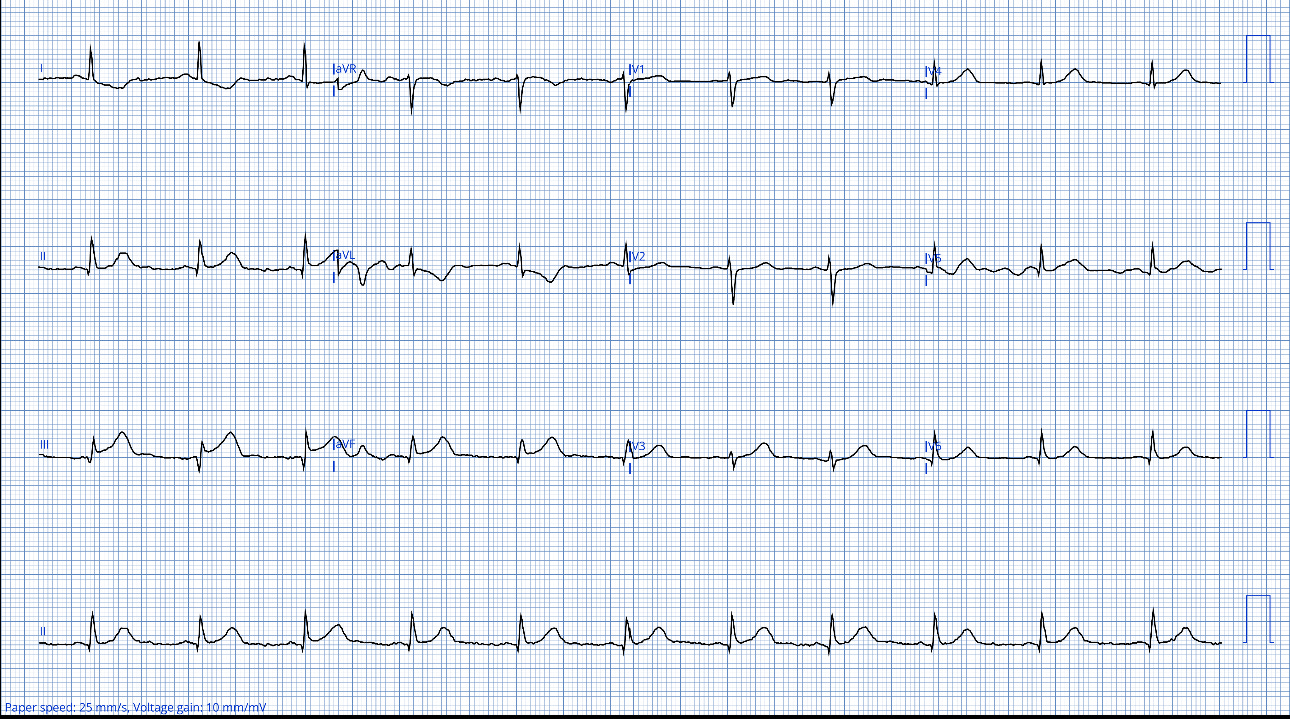
The EKG is showing ST elevation in the inferior lead with reciprocal depression in AVL, this is the STEMI pattern which is probably the most obvious one, and according to the American College of Cardiology to call it a STEMI, you must have the following criteria to meet the traditional STEMI definition:
- ST-elevation in two or more contiguous leads:
- ≥1 mm (0.1 mV) in all leads, except V2–V3.
- In leads V2–V3:
- ≥1.5 mm in women,
- ≥2 mm in men over 40 years old,
- ≥2.5 mm in men under 40 years old.
This patient met these criteria, the cath lab was immediately activated, and the patient had 100% RCA occlusion that was opened and stented.
The hyperacute T waves pattern
This EKG was obtained from a 60-year-old lady with a history of CAD and stent to LAD who presented with chest pain and shortness of breath.
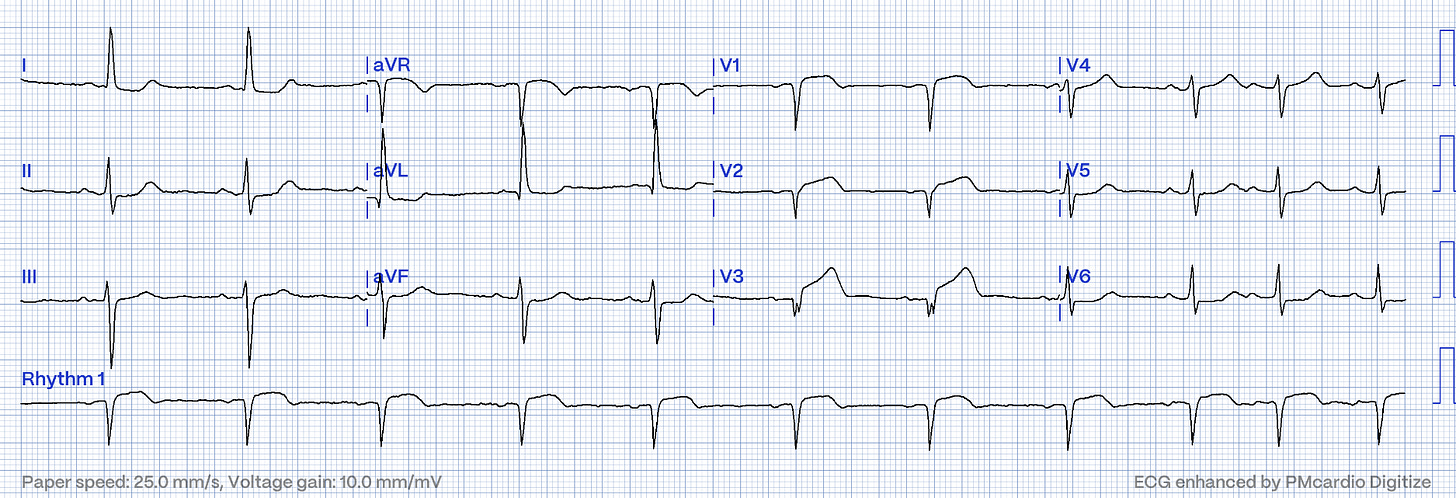
The EKG shows hyperacute T-waves in V2 and V3 along with STE that do not meet the traditional STEMI criteria. This is an acute occlusion anterior MI despite not meeting the official STEMI definition. Unfortunately, this was not picked as an acute occlusion MI because of that! Later, the first troponins came back positive and the patient was admitted as NSTEMI, she was treated medically with antiplatelets and a heparin drip, The next day she went into cardiac arrest, was resuscitated, and underwent emergent left heart cath which showed 100% in-stent-restenosis of the proximal LAD, unfortunately, she had another cardiac arrest and died shortly after that.
We must recognize the hyperacute T waves pattern! Hyperacute waves are the earliest sign of acute coronary occlusion and they don’t necessarily evolve into ST elevation as we mentioned earlier.
The shark’s fin pattern
This EKG was obtained from a 75-year-old man after he collapsed to the ground in cardiac arrest while shopping with his wife, he was successfully shocked out of V.fib and brought to the ED.
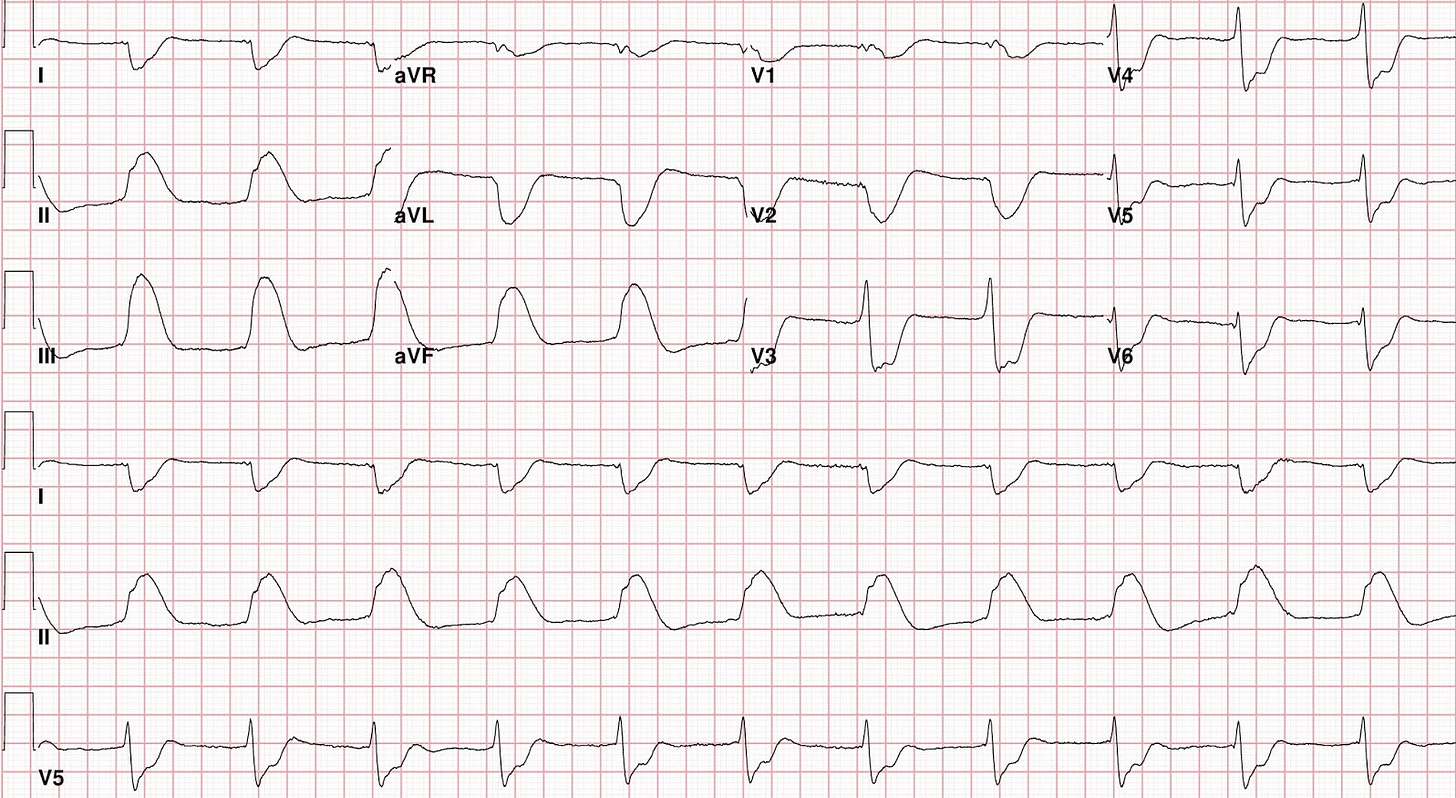
The EKG shows a deadly sign shark’s fins sign which is a combination of QRS and T-wave. There is a massive ST elevation in inferior leads, reciprocal depression in lead 1 and AVL, and ST depression in precordial leads maximum at V 2-4, this patient has an acute inferior-posterior occlusion MI. These changes are not due to Hyperkalemia, but if in doubt, check potassium level. In this case, the cath lab was activated but there was a pushback from cardiology as they thought these changes were from hyperkalemia despite his K being normal, eventually, the patient was taken to the cath lab and found to have 100% RCA occlusion, he went into cardiac arrest during the procedure and couldn’t be resuscitated. Please remember this deadly shark fin pattern!
The posterior wall MI pattern
This EKG was taken from a 70-year-old man who presented with chest pain.

There is ST depression in precordial leads V1-4 and it’s more prominent in V3 and 4, these anterior leads are reciprocal to posterior leads, this is the posterior wall MI pattern! You may want to record posterior leads to confirm although it isn’t necessary! remember the ST elevation in the posterior lead will be subtle Since these leads are further from the heart and must penetrate through the electrically insulating air of the lungs. We must activate the cath lab when we recognize the posterior wall MI pattern!
The De Winter pattern
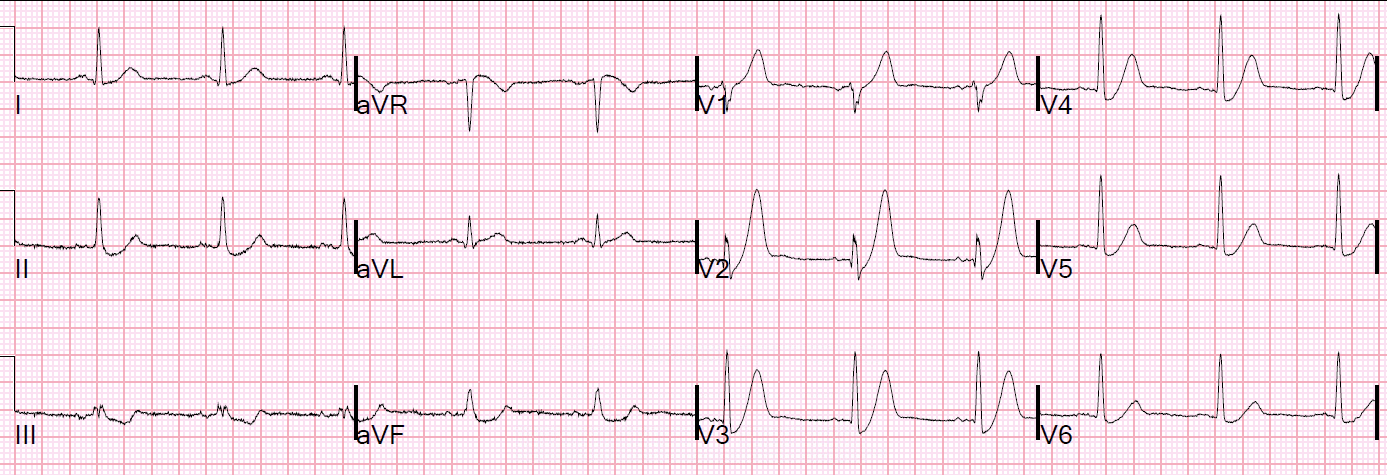
There are hyperacute T waves in the anterior leads preceded by ST depression with an upsloping ST segment, this is an important distinction from the posterior wall MI pattern where there is ST depression in the anterior lead without the distinctive upsloping ST segment of those fat and bulky hyperacute T-waves! This is the De Winter EKG pattern that is indicative of acute LAD occlusion or near occlusion.
We must recognize this pattern and activate the cath lab immediately, this patient found to have 100% LAD occlusion
Wellen’s pattern
This EKG was taken from a 43-year-old gentleman who had two episodes of chest pain which prompted him to come to the ED for evaluation, he was chest pain-free when the EKG was recorded.
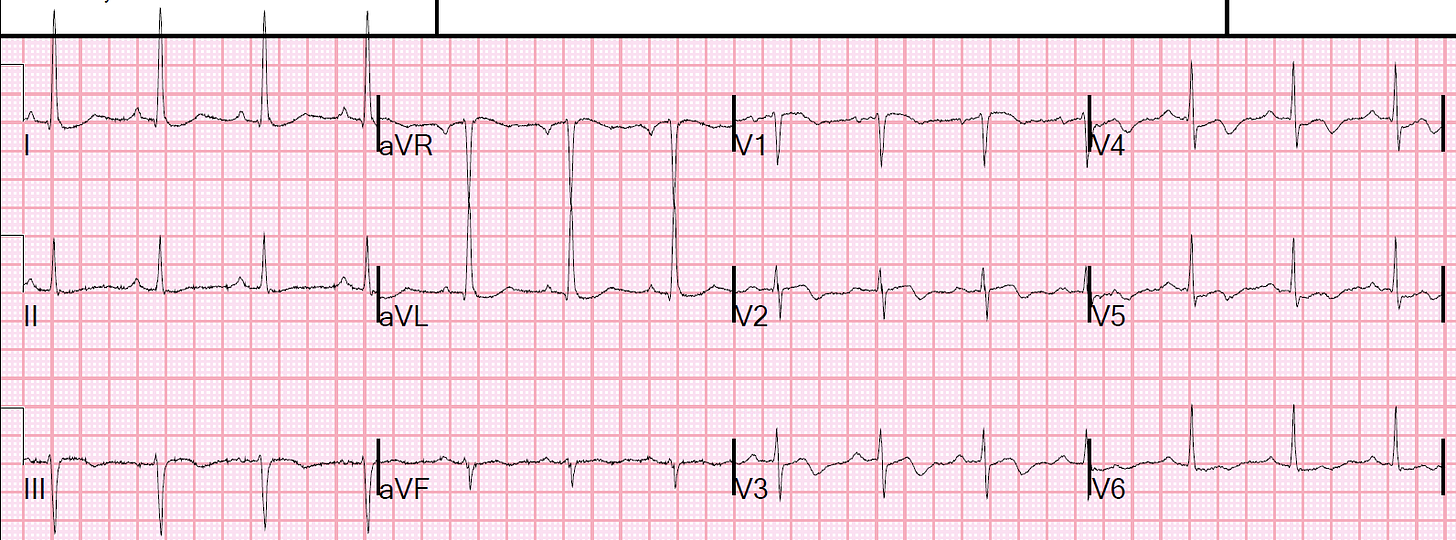
The EKG shows NSR, axis to the left, there may be LVH based on the voltage in AVL, T wave inversion in precordial leads and if you look closer you will see the inversion is in the latter part of the T wave ( Terminal wave inversion)! Remember in ACS, T wave inversion is a sign of reperfusion. These are Wellens’ waves (Wellens’ syndrome), which indicate spontaneous reperfusion of acute LAD occlusion with a very high risk for re-occlusion, It’s crucial to recognize this pattern and activate the cath lab.
Not all T wave inversions are Wellen’s waves! To call T waves inversion Wellens’ waves, they must meet the following criteria:
- Resolved anginal chest pain (They must be recorded during chest pain-free periods), remember these are reperfusion waves.
- Happens in the LAD distribution (ie: anterior and sometimes lateral leads).
- Preserved R waves and no Q waves in involved leads.
- There is no LVH in the involved leads (this can cause pseudoWellens’ waves).
The patient developed active chest pain and the following EKG was recorded.
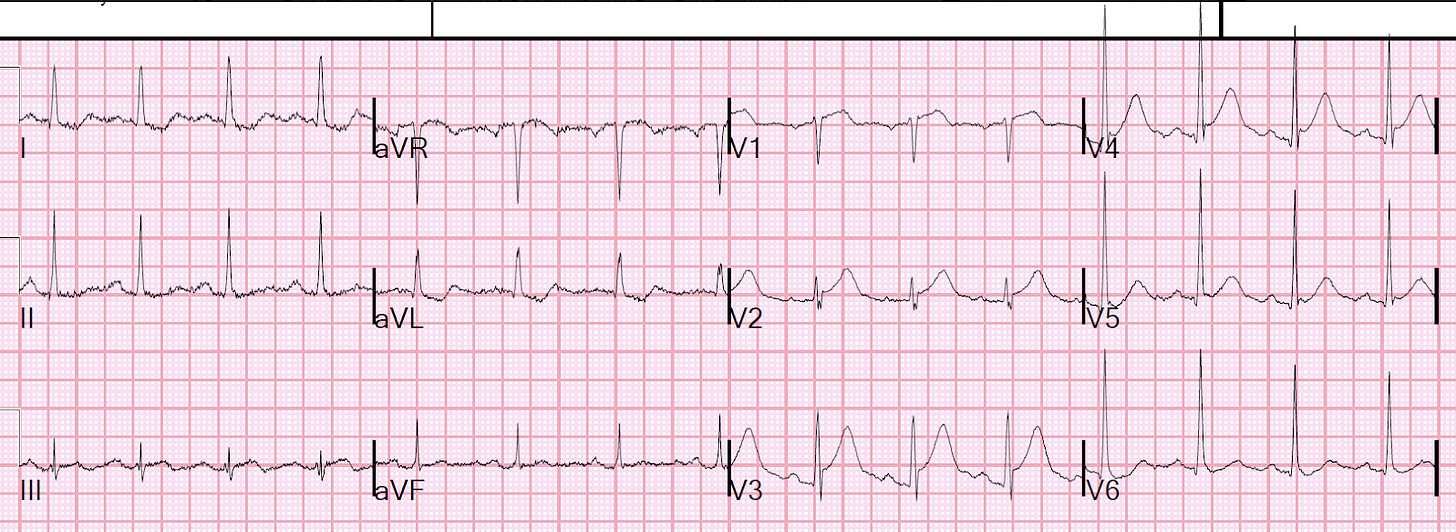
The EKG shows hyperacute T waves in anterior leads and ST elevations in V 2, 3, and 4. The patient was taken to the cath lab and a near total occlusion of LAD with thrombus) was found and stented.
The next AM, the following EKG was obtained:
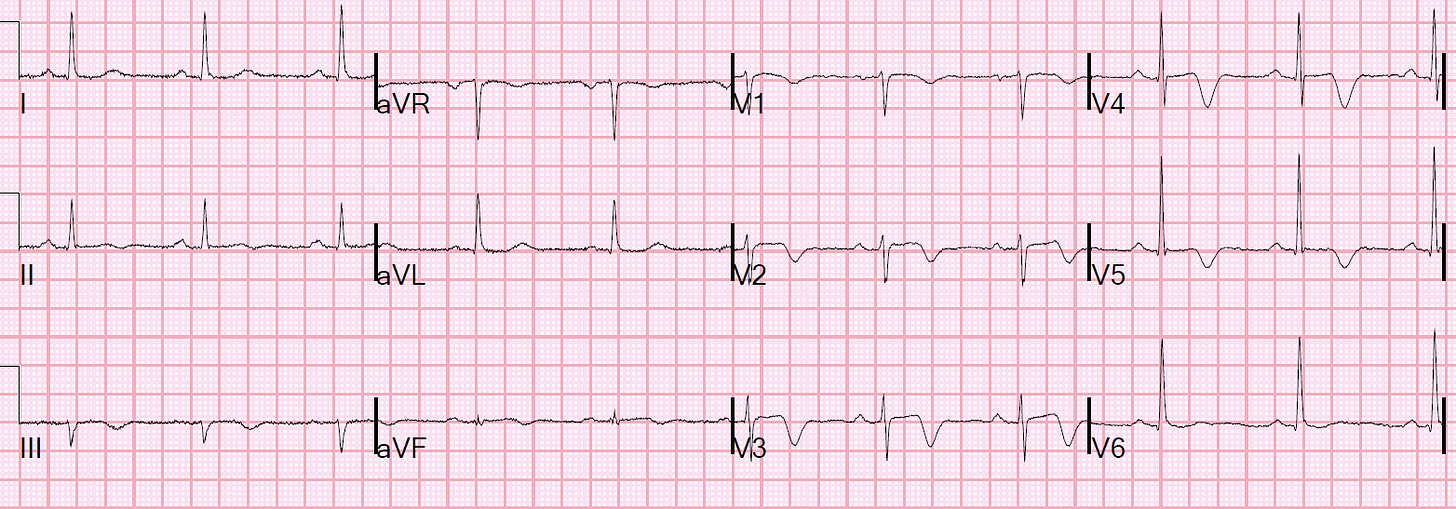
Now we see the Wellens’ waves are deeper and almost symmetric. This is what we call pattern B Wellen’s T waves, Pattern A is the terminal T wave inversion we described earlier that is typically seen soon after reperfusion which almost always evolves into type B the deep symmetric T wave inversion.
Always think of Wellens when you see T wave inversion in somebody who presented with chest pain that has resolved and the EKG obtained while chest pain-free.
The LBBB pattern
The EKG shows LBBB with wide QRS, a monophasic R wave in lateral leads, and a predominantly negative QRS in anterior leads.
LBBB produces secondary ST changes, the ST deviation is in the direction opposite that of the major deflection of the QRS, and it is proportional to the amplitude of the QRS complex, which is called “appropriate discordance”.
This means we will have a discordant nonischemic STE in leads V1-V4 in LBBB. These ST elevations must be proportional to the size of the QRS complex.
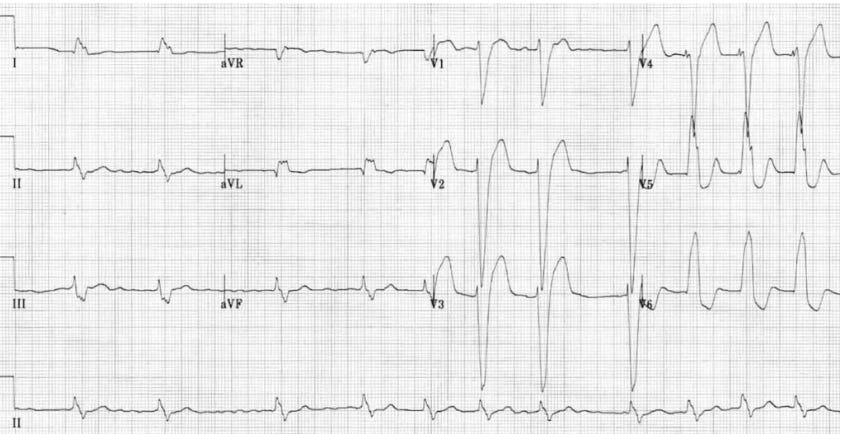
(Excessive discordant STE or any degree of concordant STE is suggestive of OMI in the appropriate clinical context)
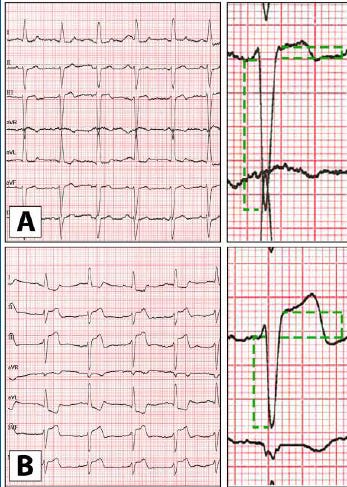
It’s easy to identify concordant STE but how do we tell if there is an excessive discordant STE? Here we use something called modified Sgarbossa criteria which uses the ratio of STE at the J-point to the preceding S-wave. Any ratio higher than 0.25 is highly specific for OMI. Take a look at this image, the ratio in A is less than 0.25 while more than 0.25 in B, B has excessive discordant STE.
This EKG was obtained from an 85-year-old gentleman with a history of hypertension who developed chest pain, collapsed, and had bystander CPR.
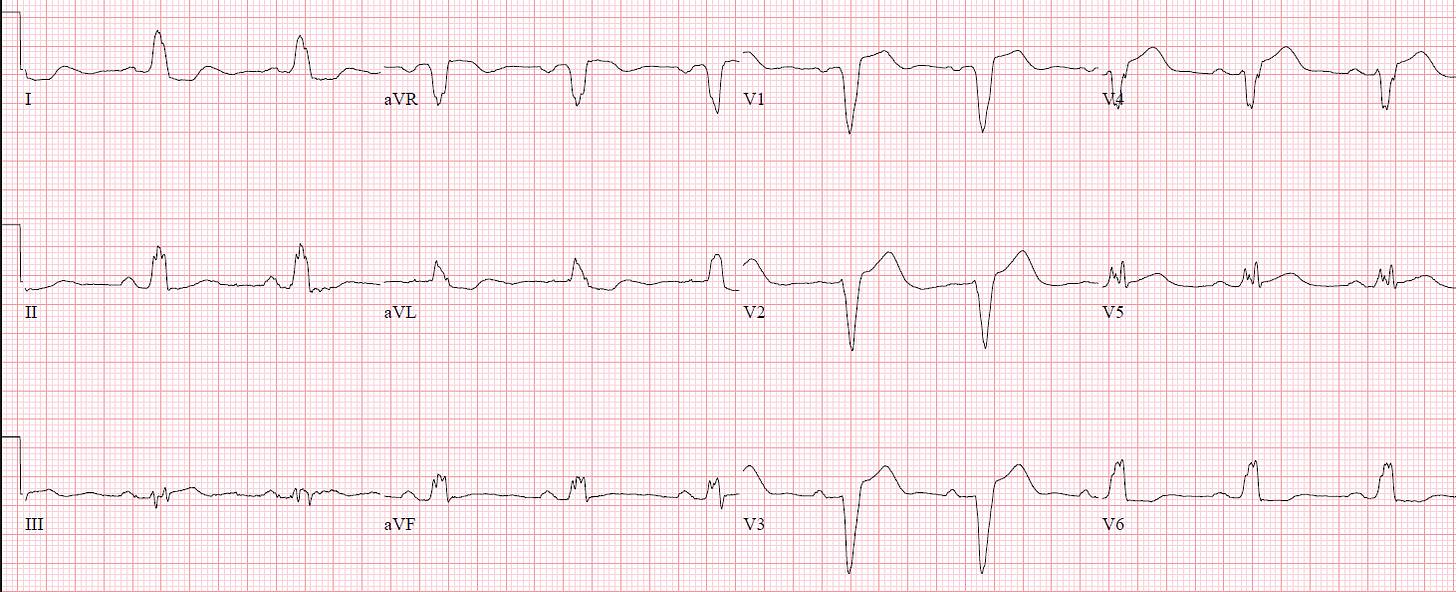
Let’s apply the modified Sgarbossa criteria to our EKG and we can see disproportionately discordant STE in V 4, the ratio between STE and the preceding S wave is 0.33 and this is very specific to OMI. There is also a concordant STE in lead 3 and V5, in lead 3 and V5 the QRS is isoelectric and so the ST segment should be isoelectric instead it’s slightly elevated.
This patient was taken to the cath lab after initial resistance from the cardiologist and was found to have a 100% mid-LAD occlusion and 90-95% RCA occlusion.
The same criteria can be applied to Right ventricular paced rhythm (VPR).
Aslanger pattern
This EKG was taken from a 50-something woman who complained of acute chest pain radiating to the left arm, onset while driving.

There is a subtle STE in lead 3 and reciprocal depression in AVL, this suggests inferior wall occlusion MI (OMI) despite the absence of official STEMI criteria, this is another reminder that the STEMI criteria can, inappropriately, exclude some patients from immediate reperfusion therapy when it’s mostly needed. If you see such a pattern, in the right clinical context, activate the cath lab!
Why is there no STE in other inferior leads (leads 2 and AVF)? It’s because there is a diffuse ST depression in I, V3-V6 with reciprocal STE in AVR! The ST depression vector is going toward lead 2 and AVF which cancels the ST elevation force in these leads, while lead 3 is far to the right away from the ST depression vector!
The presence of diffuse ST depression that’s maximum in V 4-6 (Maximum in V2-4 in post. wall MI) raises suspicion of what we call diffuse subendocardial ischemia! If there were no inferior occlusion MI, the ST segment in lead 3 would also be depressed.
Think of diffuse subendocardial ischemia whenever you see diffuse ST depression (in ≥7 leads) with ST elevation in lead aVR.
Diffuse subendocardial ischemia can be due to:
- Decreased supply from Severe Coronary Disease (due to LMain, proximal LAD, and/or severe 2- or 3-vessel disease).
- Increased demands (ie, sustained tachycardia — sinus or from some other arrhythmia; shock/profound hypotension; GI bleeding; anemia; etc.).
In a posterior wall MI, ST depression is typically localized, whereas in diffuse subendocardial ischemia, the ST depression is diffuse. Additionally, in posterior wall MI, the maximum ST depression is seen in leads V2-V4, while in diffuse subendocardial ischemia, it is most pronounced in leads V4-V6.
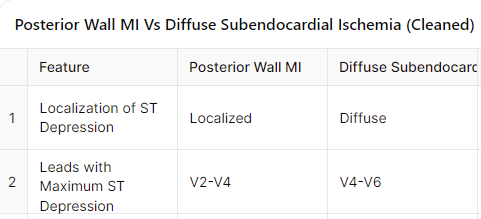
This pattern of inferior occlusion MI and diffuse subendocardial ischemia is called the Aslanger pattern:
1. Inferior OMI, with STE in lead III only, and reciprocal STD in aVL.
2. Diffuse subendocardial ischemia (ST depression, STD, in I, II, V3-V6) with reciprocal STE in aVR
Conclusion
Among these 8 EKG patterns, only the STEMI pattern meets the traditional STEMI criteria, while the posterior wall MI and De Winter patterns are considered STEMI equivalents. There should be no hesitation from cardiology in activating the cath lab for these cases!
The remaining five patterns — hyperacute T-waves, shark fin pattern, Wellens T-wave inversion, Aslanger pattern, and LBBB meeting the modified Sgarbossa’s criteria — may sometimes face resistance from some cardiologists when considering activating the cath lab. However, it is crucial to advocate for the patient when these findings are present to ensure they receive timely intervention.


10 Medications You Must Master Before Your ICU Rotation
Positive troponins! MI or not?
Comprehensive Guide to Antibiotic Spectrum: Gram-Positive, Gram-Negative, and Anaerobic Coverage